
 Since the early 1990s, IBM (IBM) has staged two major rallies and is now in its second major decline. What is particularly interesting (and helpful) to us as traders is the structure of these moves are nearly the same.
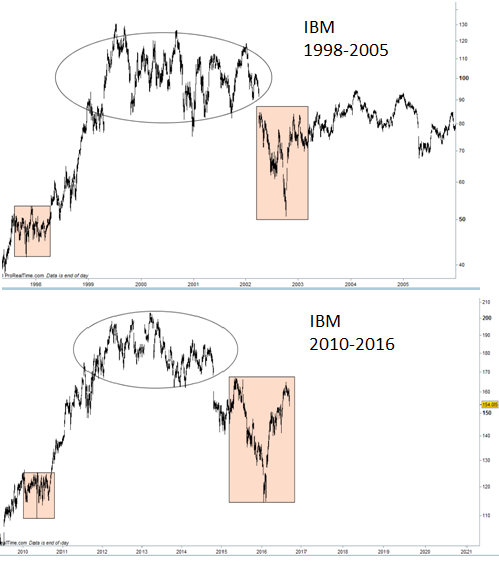
This is a fairly common topping structure. The choppy sideways action (circled) keeps everyone guessing; no-one quite knows if it is bullish consolidation or bearish distribution. The gap below the range answers that question quite emphatically and leads to a sharp spike lower (rectangle), culminating in a exhaustion gap and capitulation move into a bottom. In both cases, this happened to be in the area of the last consolidation (square).

