Summary
- Citi is priced as if it is the same cowboy-style bank prior to the financial crisis.
- I break it down by business lines to demystify the poor perception Citi often received, and show its true strength.
- Citi is a strong buy at its current price with positive asymmetrical risk/rewards.
Background
Citigroup (C) needs no introduction. A household name with its origin dated back 200 years ago, initially charted as City Bank of New York.
Unfortunately, Citi has often been perceived as a highly volatile, lower caliber bank among majors. Its reputation was severely damaged by its near-death 2007 subprime mortgage crisis. It took joint efforts from Treasury/Fed/FDIC, and a total of $300+ billion as a guarantee to cover the majority of the potential losses on Citigroup's $335 billion portfolios to bring it back to life.
Investment Thesis
My thesis builds upon one theme - the perception about Citi is far distant from the reality as I break them down.
After near one-decade continuous improvement on operational efficiency and over 60 divestiture transactions that reduced $800 billion non-core assets, the remaining businesses in Citi, especially those contribute to the majority of its revenue/net income, are top-tier businesses, and compete favorably among its peers.
My conservative model values Citi at $113 billion with a 24% potential upside to its current price.
Perception vs. Reality
Citi earned a terrible reputation (rightfully so) with its heavy exposure to troubled mortgage in the form of CDO during the financial crisis. It was saved by joint efforts of Treasury, Fed Reserve, and FDIC when over 90% of shareholders' values were wiped out.
Since then, Citi has divested over 800 billion non-core assets in over 60 transactions, including:
- Sold its hedge fund business to SkyBridge in 2012,
- Sold stakes in Indian Mortgage Lender in 2012,
- Sold Consumer Bank and Diner's Club card operation in Greece in 2014,
- Sold Alternative Investment Business in 2015,
- Sold Fixed Income Analytics unit in 2017.
Its efforts to curb operating expenses can be best demonstrated by its continued efficiency ratio improvement over time and compared favorably to JPM (59%), BOA (71%), and WFC (80.7%), as of 3Q20.
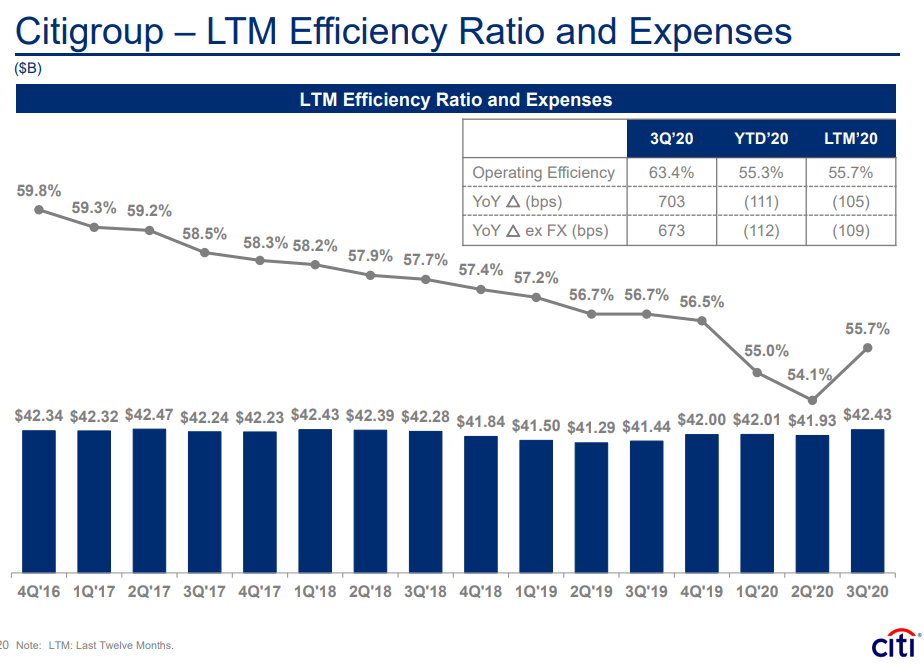
Source: 3rd qtr 2000 earning presentation
In terms of solvency, while JPM's 13% CET1 ratio leads the pack, Citi's 11.8% is on par with BAC (11.9%) and WFC (11.4%).