Summary
- Over the past three years, AWK stock price has had an average increase of about 26%.
- From 2015 until 2019, operational revenue had a CAGR of 3.4% while its operation and maintenance expense grew at 2.4%, demonstrating economies of scale.
- As a result of global industry growth of 3.68%, my belief that the company is experiencing economies of scale and is reducing its retention rate, I estimated a target price.
I have always wanted to invest in a utility directly, but for some reason, I have never invested in one. Occasionally I would glance at a water and wastewater company with the idea that demand for water is increasing while its supply is decreasing. With that thought in mind, I imagined that this industry would be able to provide at least a six percent dividend yield. I found out that it doesn't.
I remember reading a text pretty similar to the above text in one of my finance courses. Because of the information similar to the one above, I imagined that the only way I could get a decent return on my investment was to find a utility company that had a dividend yield of 6% or more.
American Water - Past Decade
American Water did not take the same finance course as I. Over the past three years, AWK's stock price has had an average increase of about 26%. During the same period, the company's average dividend yield was 2%. The company began paying dividends during the second half of 2008 and has increased its yearly dividend every year. From 2010 until 2019, AWK's dividend CAGR was 9.8%.
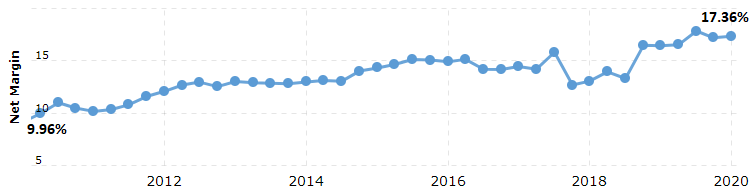
Figure 1 - Net Margin (2010 to 1Q20)
 Source: Macrotrends
As seen in figure 1, AWK's net margin has increased by 7.4% over the past ten years. During the financial crisis of 2008 and 2009, the company had a negative net margin (not shown in Figure). The company's net margin stayed around 15% from 2015 until 2016. In 2017, the company's net margin suffered due to the normalization of deferred income tax.
The enactment of the TCJA required a re-measurement of our deferred income taxes that materially impacted our 2017 results of operations and financial position. (Source: Page 27 of 2017 Annual Report)
After 2018, the company's net margin began to normalize between 16.5% to 17.2% thanks to the reduction of the corporate tax rate.
Figure 2 - Retention Rate
| 2015 | 2016 | 2017 | 2018 | 2019 | |
| BASIC EPS | 2.66 | 2.63 | 2.39 | 3.16 | 3.44 |
| DIVIDENDS | 1.36 | 1.5 | 1.66 | 1.82 | 2.00 |
| RETENTION RATE | 51% | 43% | 31% | 42% | 42% |
Source: Company's Financials
Over the past five years, the company has had an average retention rate of 42%. Not taking into consideration 2017, the AWK seems to be slowly reducing its retention rate. Currently, AWK's forward dividend yield is 1.66%, while its peer average is 1.84%.

